
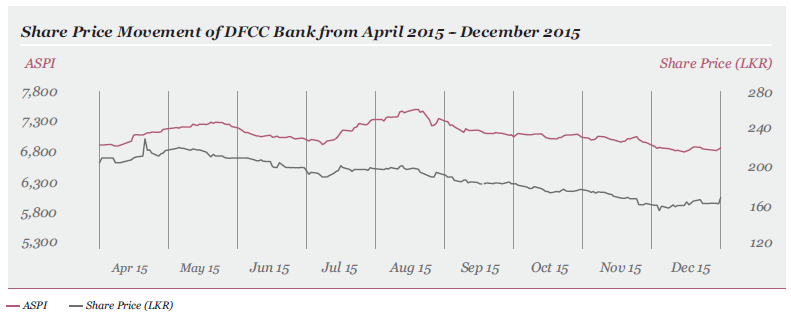
The market value of the DFCC Bank PLC ordinary share on 31 December 2015 was LKR 168.90, compared to LKR 202.90 on 31 March 2015. During the nine months period, the highest price of LKR 230.00 was recorded on 21 April 2015. The lowest price for the period was recorded on 3 December 2015 as LKR 155.00.
The share price of DFCC Bank followed the movement of the All Share Price Index (ASPI) closely during the period under review.
DFCC Bank Share Price Information
| 9 months ended
31 December 2015 |
Period 1 April to 31 March | |||
| 2015 | 2014 | 2013 | ||
| Price Indices | ||||
| ASPI | 6,894.50 | 6,820.34 | 5,968.31 | 5,735.68 |
| S&P SL 20 | 3,625.69 | 3,852.43 | 3,279.92 | 3,293.57 |
| Share Price | ||||
| Lowest Price (LKR) | 155.0
(03.12.2015) |
144.7
(01.04.2014) |
115.0
(15.11.2013) |
103.00
(07.06.2012) |
| Highest Price (LKR) | 230.0
(21.04.2015) |
239.0
(07.10.2014) |
154.0
(13.01.2014) |
131.80
(28.03.2013) |
| Closing Price (LKR) | 168.9
(31.12.2015) |
202.9
(31.03.2015) |
143.0
(31.03.2014) |
131.10
(28.03.2013) |
| Market Capitalisation | ||||
| Value (LKR million) | 44,775 | 53,788 | 38,148 | 34,754 |
| Percentage of total market cap | 1.52 | 1.86 | 1.53 | 1.58 |
| Rank | 14 | 11 | 13 | 13 |
| Value of Shares Traded | ||||
| Value (LKR million) | 1,717 | 6,761 | 906 | 1,315 |
| Percentage of total market turnover | 0.91 | 1.91 | 0.46 | 0.69 |
| Rank | 25 | 9 | 45 | 26 |
| Days Traded | ||||
| No. of days traded | 182 | 239 | 241 | 239 |
| Total No. of market days | 183 | 239 | 243 | 239 |
| Percentage of market days traded | 99.5 | 100.0 | 99.2 | 100.0 |
| Frequency of Shares Traded | ||||
| No. of transactions | 4,654 | 9,020 | 5,444 | 5,171 |
| Percentage of total frequency | 0.41 | 0.45 | 0.37 | 0.32 |
| Rank | 81 | 78 | 82 | 99 |